Introduction
Data drift occurs when the characteristics of the data encountered by a model in production deviate significantly from those of the dataset on which the model was trained.
Basic concepts:
- Baseline: Users can define the baseline basis on ‘Tag’ or segment of data based on ‘date’.
- Frequency: Users can define how frequently they want to calculate the monitoring metrics
- Alerts frequency: Users can configure how frequently they want to be notified about the alerts
Create drift
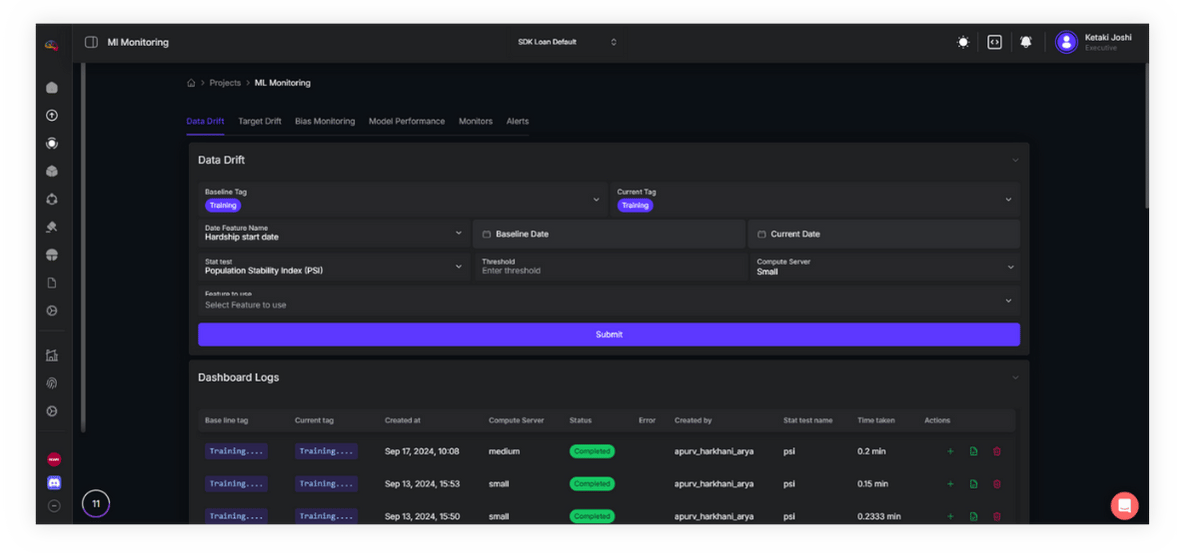
To set up a data drift dashboard in AryaXAI, define the baseline and current tags, date feature name, baseline and current dates, the feature to be analyzed, statistical method for drift calculation, and customize thresholds if necessary. You can select the compute option based on the specific server requirements for the data drift task.

Your dashboard will then be generated, and you have the flexibility to create or modify it as needed without limitations on the number of times.
Drift Metrics: AryaXAI offers various statistical tests to analyze data drift, including the Chi-square test, Jensen-Shannon distance, Kolmogorov-Smirnov (K-S) test, Kullback-Leibler Divergence, Population Stability index (Psi), Wasserstein distance, and Z-test.
You can learn more about these tests in our wiki section.
Selecting Dates: When choosing dates, the entire dataset under the specified tag will be utilized for drift calculation. Ensure that relevant data is available within the selected date range.
Mixing Multiple Tags: To merge data from different tags, you can easily select multiple tags within the segment (baseline/current).
Data drift monitor
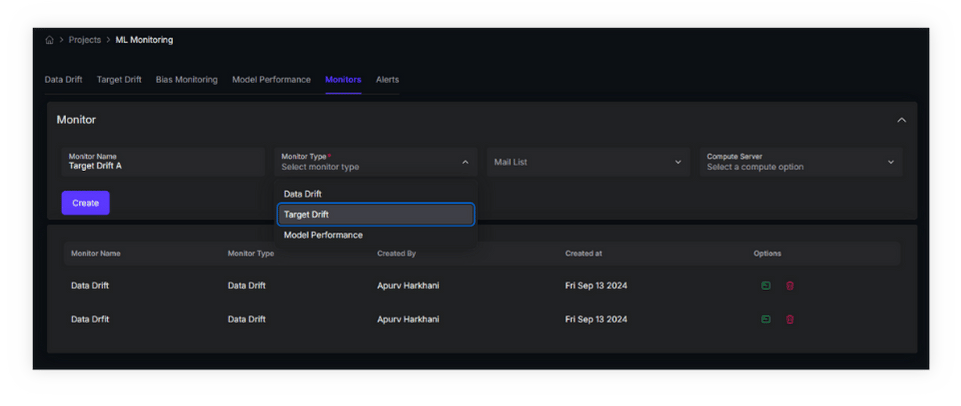
Within AryaXAI, you have the capability to track data drifts and receive notifications upon detecting any identified drift in your data. To create a Data Drift monitor:

- Navigate to the 'Monitors’ tab in ML Monitoring and select 'Create Monitor’.
- Assign a name for the monitor and choose 'Data drift' as the monitor type. Select the email list to which you want the alerts to be sent.
- Select the compute option based on the specific server requirements for the data drift monitor
- Choose the statistical test and set thresholds for data drift, dataset drift, and data drift feature percentage.
- Utilize tags to define the baseline and current data. 'Current' typically represents production data for tracking drift in your production environment.
- Select features to monitor. You can either create one monitor to track all features in your data or specify individual features for drift tracking.
- Utilize the date features to further segment your baseline and set the monitoring frequency.
- You can also specify the frequency for calculating drift. the frequency can be either hours, or on daily, weekly, monthly and even quarterly basis.
Manage drift
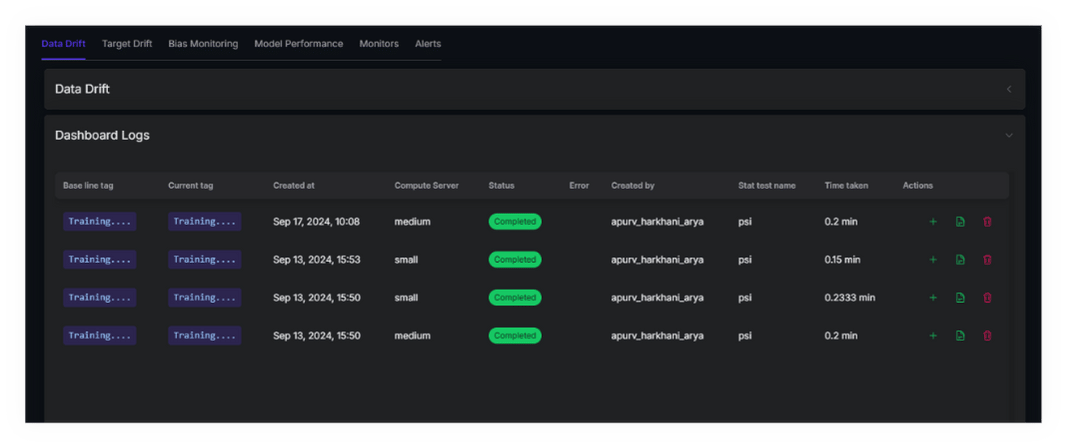
Any new dashboard created for data drift analysis will be listed in the 'Dashboard Logs', where you can view details such as the baseline and associated tags, the creation date and name of the dashboard, the owner, and the statistical test used for detecting data drift. In the Actions column, you have options to expand or collapse the dashboard to view or hide detailed information, configure alerts based on the specific dashboard configuration, or delete the dashboard from the logs.

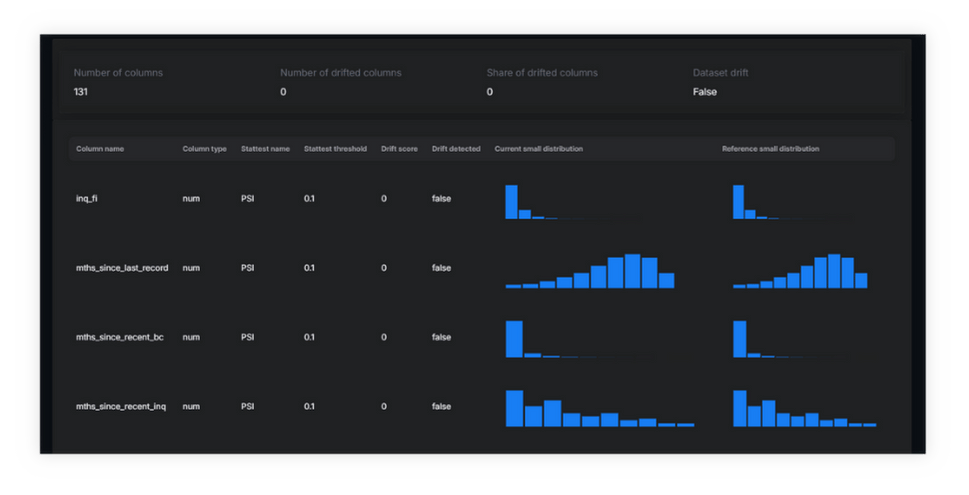
Selecting the 'View this dashboard' option in the Actions column displays a detailed dashboard based on tags configured.

For all the logs listed here, users can configure automatic alerts based on the dashboard log. This option is available in the 'Alerts' column.
Alerts
In the event of identified drift, alerts are generated and delivered through both the web application and email based on the specified frequency.
Any triggered alert is promptly displayed as a notification in the top-right corner of the web application interface. All notifications can be accessed and cleared from the dedicated tab.
Navigate to the 'Alert' tab adjacent to the 'Monitoring' sub-tab to access a list of triggered alerts. Clicking 'View trigger info' provides detailed insights into the trigger, including current data size, triggered data drift, drift percentage, and more.
Notifications
If there is an identified drift, you'll get the alert for the same in both the web app and email at the specified frequency.
Web app alerts: Any alert triggered will be displayed as a notification on the top right corner. You can view all notifications from the tab and clear them.
Email Alerts: The admin of the workspace will get an email if there is an identified drift.


